2.4 Sequence diagrams
2.4 Sequence diagrams
As David Harel has eloquently stated: While bridges and other architectural buildings are there to be, software systems are there to do. Thus, it is inevitable that behavioral notations are needed in addition to structural notations. In order to describe the overall behavior of a system, it is useful to look at the interactions among its components, and its interactions with the environment. Sequence diagrams present interactions in two dimensions. At the top level, the involved objects are shown. From top to bottom, the order of the method calls between the objects is shown according to a timeline. A sequence diagram tells a story about a system. The story describes a certain aspect of the running system namely a number of collaborating objects and how they interact in a particular situation.
2.4.1 Sequence diagram example
The sequence diagram in Figure 2.5 presents an interaction between one Bank object with the name db and two Account objects with the names a and c. The diagram shows how these objects interact in order to transfer an amount, m, between the two accounts. A transfer(m,a,c) message is issued by the environment possibly by some user interface component. The message activates the corresponding method in the Bank object, leading to three more calls. One of these calls is object recursive the log_transfer() method is invoked on Bank itself.[10]
[10] A call of another method of the same object is not recursive in the sense of the classical definition, but it is object recursive. Such calling structures employ special power as a large number of design patterns are based on them. But a recursive calling structure also needs careful programming because the object state may exhibit temporal inconsistency during activation. The calling object and the calling method must be robust with regard to changes in the called methods.
Figure 2.5. A sample sequence diagram
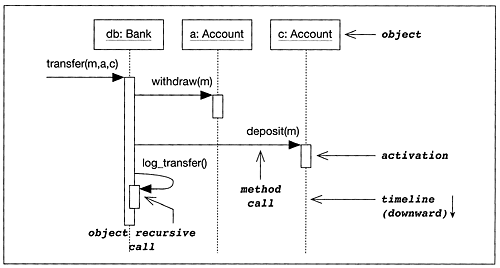
The duration of a method can be shown by using an activation box. However, we use the timeline only qualitatively, which means the actual length of an activation box or distance between two method calls does not give any quantitative measure about execution time duration. The objects in the sequence diagram use the same naming conventions as in object diagrams.
In a system that applies information hiding, an attribute is normally only changed by the object owning that attribute. Thus, method calls are the important interactions between objects. Method calls often have return values. If it is relevant to show a return value in a diagram, a dashed arrow can be used. It also happens that an object is created dynamically during an interaction sequence. Both object creation and return values can be described in a sequence diagram, as shown in Figure 2.6. In this figure, activations are omitted. Instead, two return arrows are shown carrying the account number of the newly created Account object. This object is not drawn at the top level in the diagram in order to indicate that it is created as a reaction to the Bank object's open_account request.
Figure 2.6. Return parameters and object creation in sequence diagrams

2.4.2 Considerations about collaboration diagrams
UML provides an alternative way to present interaction sequences, namely collaboration diagrams. These diagrams exhibit information similar to sequence diagrams, but present it in a different form. Instead of showing a timeline, a numbering of the interactions between the collaborating objects is used. Thus, collaboration diagrams can use two dimensions to arrange objects, instead of only the horizontal axis as in sequence diagrams. Collaboration diagrams are thus similar to object diagrams in layout and intuition.
In practice, following the time axis of sequence diagrams is often a more intuitive way to grasp the interactions than following the numbered arrows of collaboration diagrams.
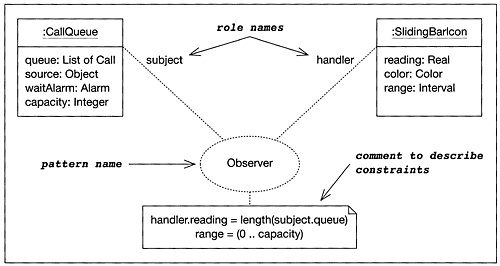
UML also provides concepts to describe aspects of design patterns, by using collaboration diagrams. Figure 2.7 is taken directly from the UML standard document. It demonstrates the application of the Observer design pattern (Gamma et. al., 1995) to two respective classes. It uses constraints in a comment to describe structural invariants between participating classes. The ellipse denotes a pattern, and lines serve as connections to participating classes. However, given the generally high density of design patterns in a framework, such a representation could quickly clutter a framework class diagram. Another drawback is that it does not show which attributes or methods actually participate in a design pattern. The following chapters address this problem, introducing a significantly enhanced design pattern annotation as the core of the UML-F profile. The collaboration diagram based notation still represents an alternative and is suitable, for example, when the details of a pattern are irrelevant.
Figure 2.7. UML suggestion for pattern description
EAN: 2147483647
Pages: 84